
This article outlines the COGs by Stocktake Report which allows for viewing Cost Of Goods data over the time span of two (2) Stocktake Periods where the Date/Time of the 1st Stocktake is the beginning of the Reporting Period and the Date/Time of the 2nd Stocktake is the end of the Reporting Period.
This offers greater flexibility for analysis of Cost of Goods data beyond using the '_History' View of the standard Stocktake Report and this Report can provide a great deal of financial insight and perspective.
Use the Reporting Options to configure the Report as desired; select a Venue and Store, choose the desired Stocktakes, and select various flags and/or Product List options to cater to the Report as required.
The Standard View for this Report provides a plethora of useful information for analysis including various Costs, Units Sold, Profit Amounts and Percentages, and Days On Hand.
Prerequisites- To access COGs features, the applicable Operator Privileges will need to be enabled
- Operator Maintenance 'Reporting' Tab
- Other Reports: "Allow Analysis Reports" flags
Accessing the Report
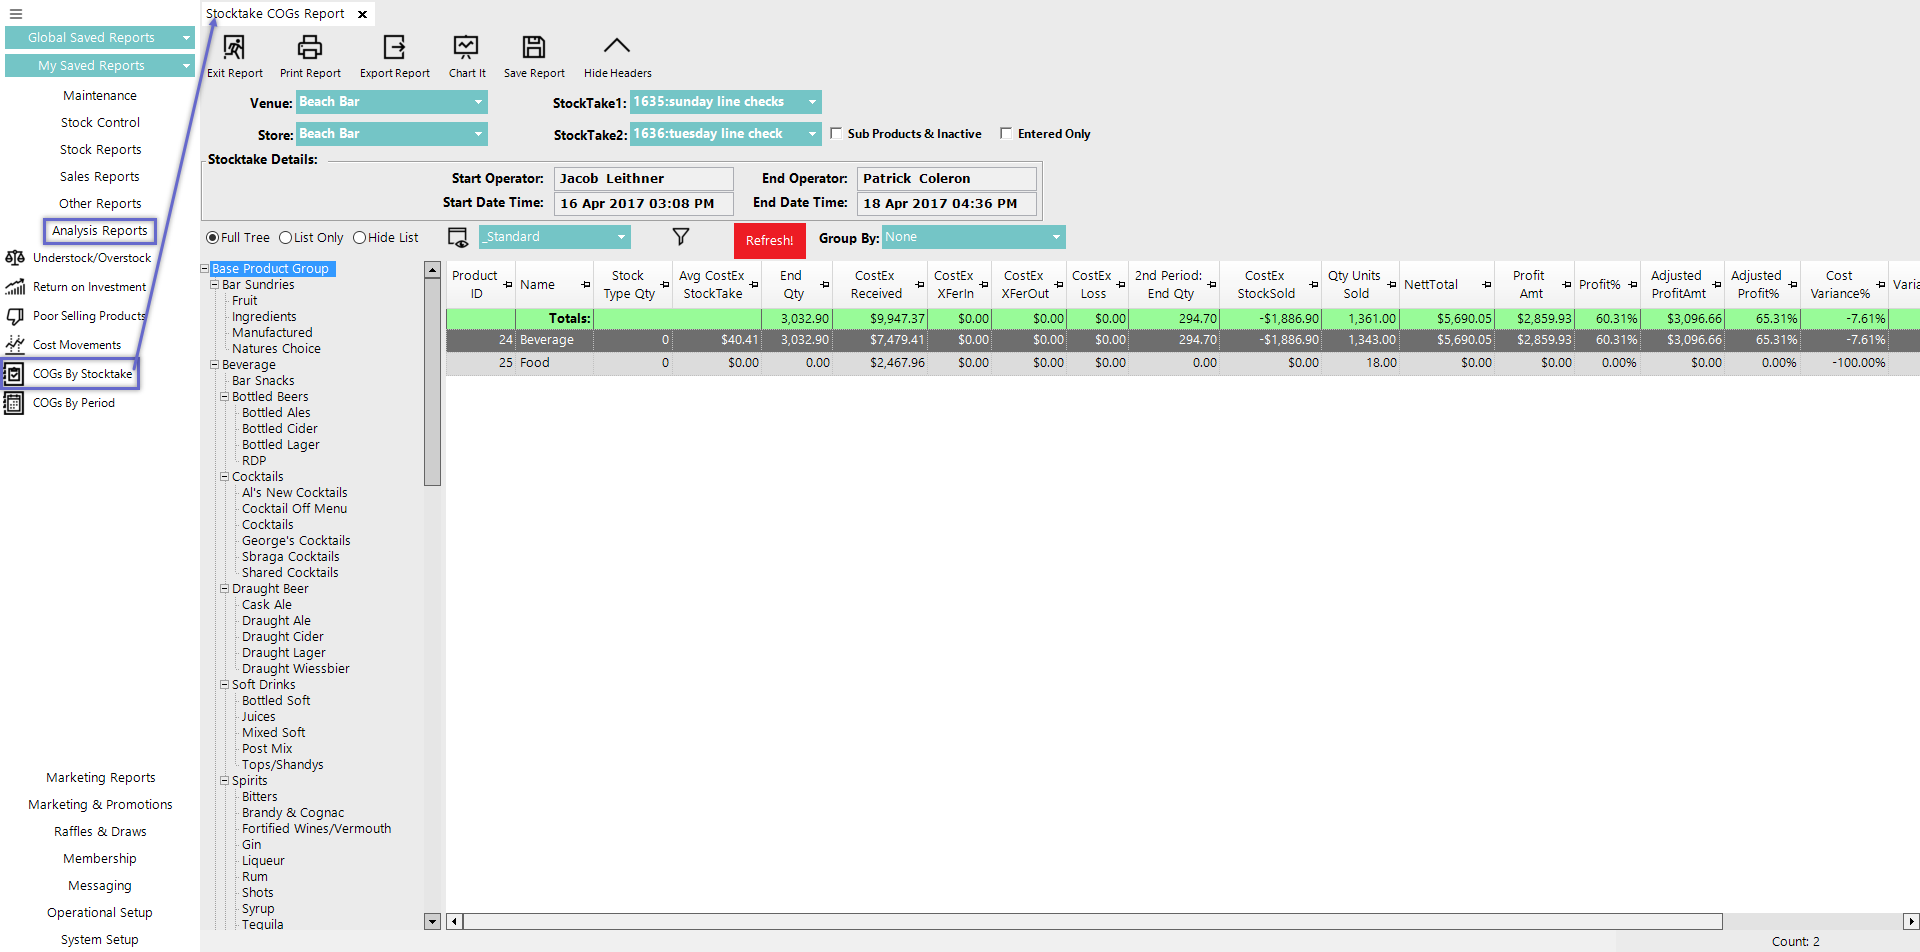
- To locate the COGs By Stocktake Report - after logging into BackOffice, navigate to the side menu where Analysis Reports can be found
- After expanding the Analysis Reports menu, the COGs By Stocktake Report will be available for selection
- Select the Report and once the tab opens choose the preferred Reporting Options (see below for details) and then click the Display/Refresh button to run the Report
Reporting Options
Option |
Description |
Visual/s (if applicable) |
| Venue drop-down |
|
|
| Store drop-down |
|
|
| StockTake drop-downs |
|
|
| Sub Products & Inactive flag |
|
|
| Entered Only flag |
|
|
| Stocktake Details |
|
|
| Full Tree radial |
|
|
| List Only radial |
|
|
| Hide List radial |
|
|
| Group By drop-down |
|
|


===
Standard View
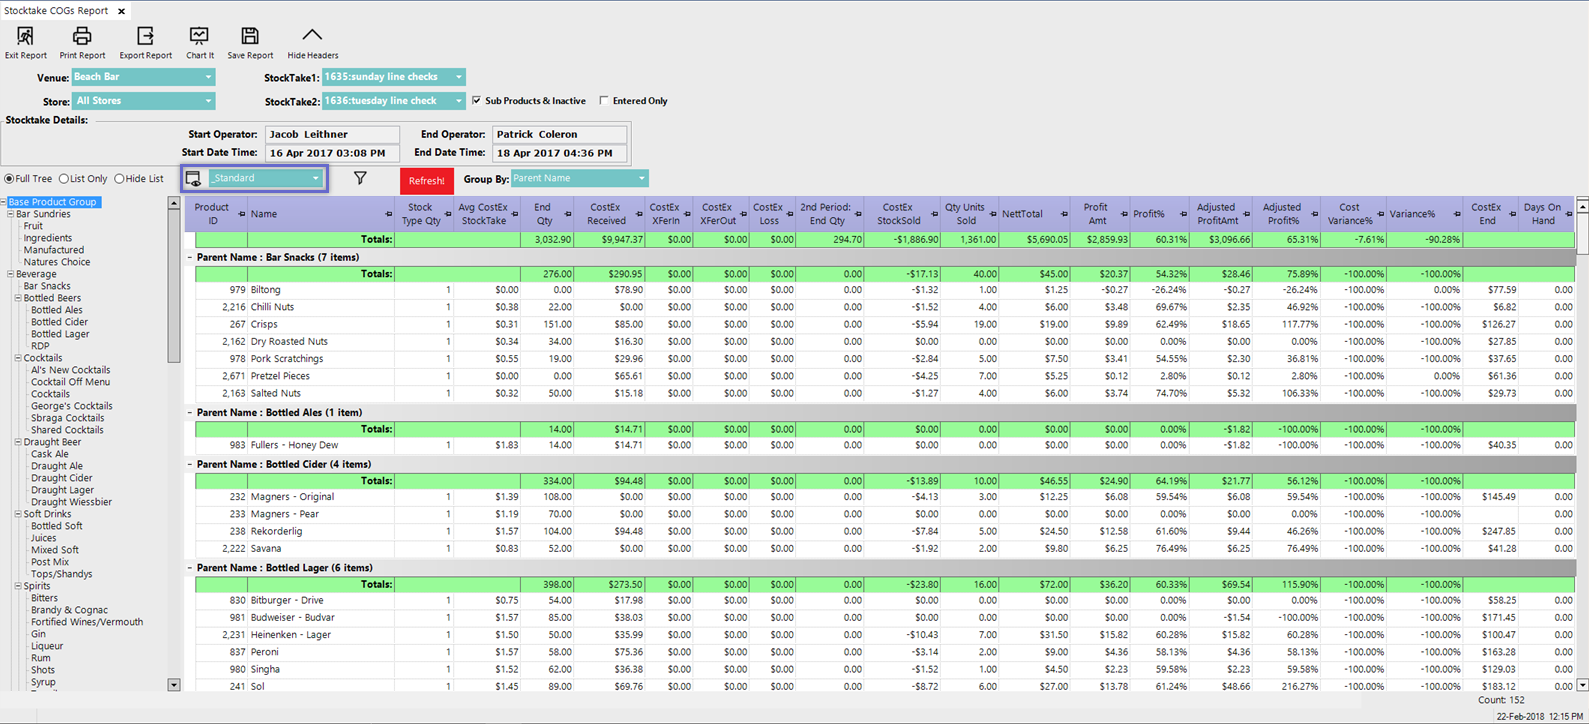
- The COGs By Stocktake Report has a Standard View which is unique to this Report
- Alternatively, additional Views can be added by selecting the View icon and completing the standard procedure for Adding and/or Editing Views
- The '_Standard' View of the COGs By Stocktake Report contains the following columns:
- Product ID
- Name
- Stock Type Qty which refers to the Product's Base Volume or Size; e.g. if a Product has a Base Volume of 750 Mills, the Stock Type Qty will be 750
- Avg CostEx StockTake
- End Qty which refers to the End Quantity of the 1st Period (Stocktake 1) and this is the starting Quantity On Hand for the time span being Reported
- CostEx Received
- CostEx XferIn (transferred in)
- CostEx XferOut (transferred out)
- CostEx Loss
- 2nd Period End Qty
- Qty Units Sold
- CostEx StockSold
- NettTotal
- Profit Amt
- Profit%
- Adjusted ProfitAmt
- Adjusted Profit%
- Variance%
- Cost Variance%
- 2nd Period End Cost Ex
- Days On Hand