
This article explains the formulas that are used to generate different columns of Stock Summaries Report data.
The system provides three types of View options to display the report, which are: Standard View; Transfers View; and Loss View. These View options have different data columns which can be generated by using general or customized formulas.
Prerequisites- To access Stock Summary Settings, the applicable Operator Privileges will need to be enabled
- Operator Maintenance 'Reporting' Tab
- Sales Reports: "Allow Stock Reports" Flag
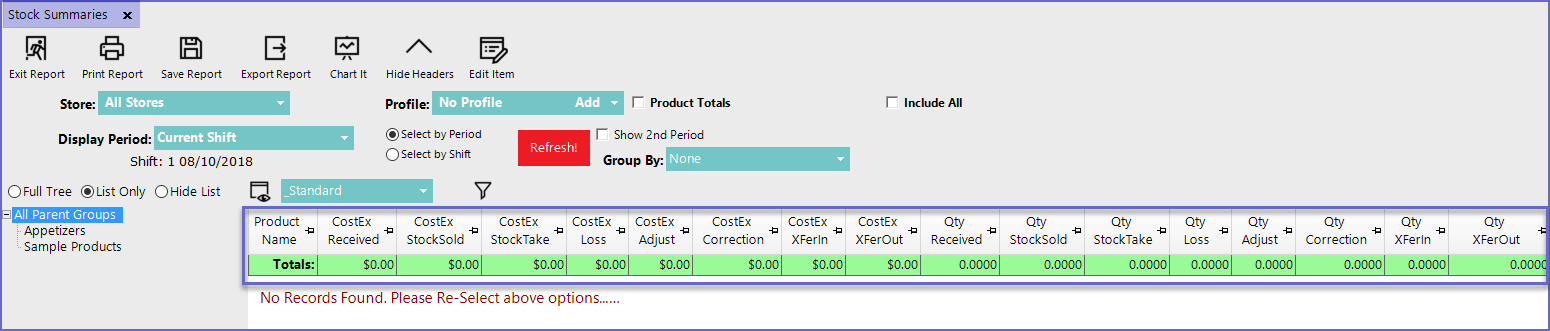
"_Standard" View Formulas
- The Standard View for the Stock Summaries Report consists of the following data columns by default:
Column Heading |
Data Description |
Formulas |
| Cost Ex Received |
|
|
| Cost Ex Stock Sold |
|
|
| Cost Ex Stock-Take |
|
|
| Cost Ex Loss |
|
|
| Cost Ex Adjust |
|
|
| Cost Ex Correction |
|
|
| Cost Ex XferIn |
|
|
| Cost Ex XferOut |
|
|
| Qty Received |
|
|
| Qty StockSold |
|
|
| Qty Stocktake |
|
|
| Qty Loss |
|
|
| Qty Adjust |
|
|
| Qty Correction |
|
|
| Qty XferIn |
|
|
| Qty XferOut |
|
|
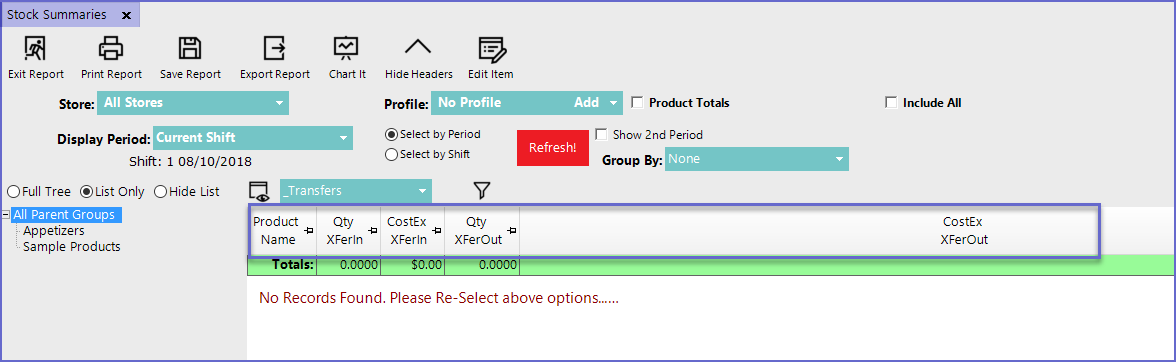
"_Transfers" View Formulas
- The Transfers View contains the following data columns by default:
Column Heading |
Data Description |
|
| Qty XferIn |
|
|
| CostEx XferIn |
|
|
| Qty XferOut |
|
|
| CostEx XferOut |
|
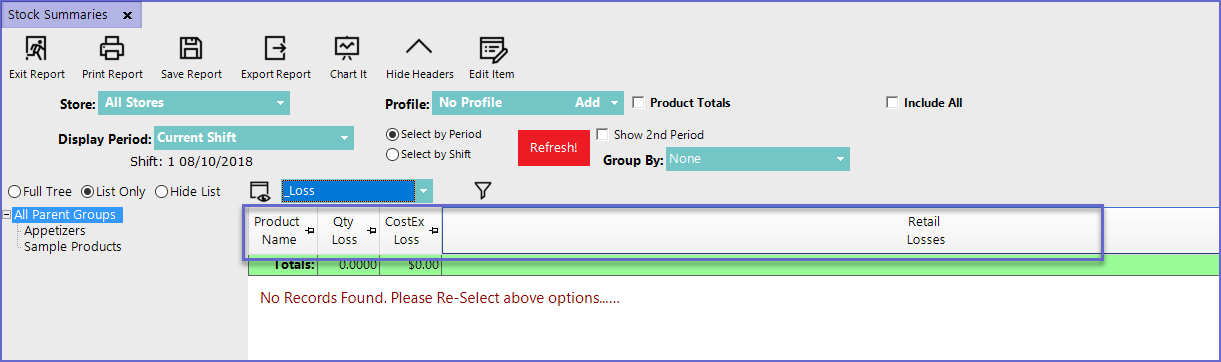
"_Loss" View Formulas
- The Loss View contains the following data columns by default:
Column Heading |
Data Description |
Formula |
| Qty Loss |
|
|
| CostEx Loss |
|
|
| Retail Losses |
|
|