
-
End-User | Products & SmartPOS
-
End-User | Stock Control
-
End-User | Table Service and Kitchen Operations
-
End-User | Pricing, Marketing, Promotions & Accounts
- Prize Promotions
- Points, Points Profiles and Loyalty
- Product Promotions
- Repricing & Discounts in SmartPOS
- Vouchers
- Account Till Functions
- Pricing, Price Numbers and Price Modes
- Raffles & Draws
- Marketing Reports
- Accounts and Account Profiles
- Rewards
- SmartPOS Account Functions
- Troubleshooting
- Product Labels
- Packing Slips
-
End-User | System Setup & Admin
-
End-User | Reporting, Data Analysis & Security
-
End-User | Membership & Scheduled Billing
-
End-User | Operators, Operator Permissions & Clocking
-
Interfaces | Data Send Interfaces
-
Interfaces | EFTPOS & Payments
- NZ EFTPOS Interfaces
- Linkly (Formerly PC-EFTPOS)
- Adyen
- Tyro
- ANZ BladePay
- Stripe
- Windcave (Formerly Payment Express)
- Albert EFTPOS
- Westpac Presto (Formerly Assembly Payments)
- Unicard
- Manager Cards External Payment
- Pocket Voucher
- OneTab
- Clipp
- eConnect-eConduit
- Verifone
- AXEPT
- DPS
- Liven
- Singapore eWallet
- Mercury Payments TRANSENTRY
- Ingenico
- Quest
- Oolio - wPay
-
Interfaces | SMS & Messaging
-
Interfaces | Product, Pricing, Marketing & Promotions
- Metcash Loyalty
- Range Servant
- ILG Pricebook & Promotions
- Oolio Order Manager Integration
- Ubiquiti
- Product Level Blocking
- BidFood Integration
- LMG
- Metcash/IBA E-Commerce Marketplace
- McWilliams
- Thirsty Camel Hump Club
- LMG Loyalty (Zen Global)
- Doshii Integration
- Impact Data
- Marsello
- IBA Data Import
- Materials Control
- Last Yard
- Bepoz Standard Transaction Import
-
Interfaces | Printing & KDS
-
Interfaces | Reservation & Bookings
-
Interfaces | Database, Reporting, ERP & BI
-
Interfaces | CALink, Accounts & Gaming
- EBET Interface
- Clubs Online Interface
- Konami Interface
- WIN Gaming Interface
- Aristocrat Interface
- Bally Interface
- WorldSmart's SmartRetail Loyalty
- Flexinet & Flexinet SP Interfaces
- Aura Interface
- MiClub Interface
- Max Gaming Interface
- Utopia Gaming Interface
- Compass Interface
- IGT & IGT Casino Interface
- MGT Gaming Interface
- System Express
- Aristocrat nConnect Interface
- GCS Interface
- Maxetag Interface
- Dacom 5000E Interface
- InnTouch Interface
- Generic & Misc. CALink
-
Interfaces | Miscellaneous Interfaces/Integrations
-
Interfaces | Property & Room Management
-
Interfaces | Online Ordering & Delivery
-
Interfaces | Purchasing, Accounting & Supplier Comms
-
SmartPOS | Mobile App
-
SmartPDE | SmartPDE 32
-
SmartPDE | Denso PDE
-
SmartPDE | SmartPDE Mobile App
-
MyPlace
-
MyPlace | myPLACE Lite
-
MyPlace | Backpanel User Guides
- Bepoz Price Promotions
- What's on, Events and tickets
- Staff
- System Settings | Operational Settings
- Vouchers & Gift Certificates
- Member Onboarding
- Members and memberships
- System Settings | System Setup
- Reports and Reporting
- Actions
- Offers | Promotions
- Messaging & Notifications
- System Settings | App Config
- Surveys
- Games
- User Feedback
- Stamp Cards
-
MyPlace | Integrations
-
MyPlace | FAQ's & How-2's
-
MyPlace | Release Notes
-
YourOrder
-
YourOrders | Backpanel User Guides
-
YourOrders | YourOrder Kiosk User Guide
-
YourOrders | Merchant App User Guide
-
WebAddons
-
Installation / System Setup Guides
- SmartPOS Mobile App | Setup
- SmartPOS Mobile App | SmartAPI Host Setup
- SmartPOS Mobile App | BackOffice Setup
- SmartPOS Mobile App | Pay@Table setup
- SmartKDS Setup 4.7.2.7 +
- SmartKDS Setup 4.6.x
- SQL Installations
- Server / BackOffice Installation
- New Database Creation
- Multivenue Setup & Config.
- SmartPOS
- SmartPDE
- Player Elite Interface | Rest API
- Interface Setups
- Import
- KDSLink
- Snapshots
- Custom Interface Setups
-
HOW-2
- Product Maintenance
- Sales and Transaction Reporting
- SmartPOS General
- Printing and Printing Profiles
- SQL
- Repricing & Discounts
- Stock Control
- Membership
- Accounts and Account Profiles
- Miscellaneous
- Scheduled Jobs Setups
- Backoffice General
- Purchasing and Receiving
- Database.exe
- EFTPOS
- System Setup
- Custom Support Tools
-
Troubleshooting
-
Hardware
1 | Accessing Dashboards
This article outlines how to access Dashboards in BackOffice. Dashboards show an aggregate summary of all the business Transactions for a given period of time in the format of tables, graphs, and charts. This information is often used by businesses while analyzing the data and making decisions. In Bepoz, Dashboards can be accessed and customized according to the convenience of the Operator so that it is easier for viewing and understanding the Business Operation.
This article outlines how to access Dashboards in BackOffice.
Dashboards show an aggregate summary of all the business Transactions for a given period of time in the format of tables, graphs, and charts.
This information is often used by businesses while analyzing the data and making decisions.
In Bepoz, Dashboards can be accessed and customized according to the convenience of the Operator so that it is easier for viewing and understanding the Business Operation.
Accessing Dashboards- Login to BackOffice
- Click on the "Dashboards" icon from the Main Menu Bar
- It will open a Dashboard window where all the available data is displayed
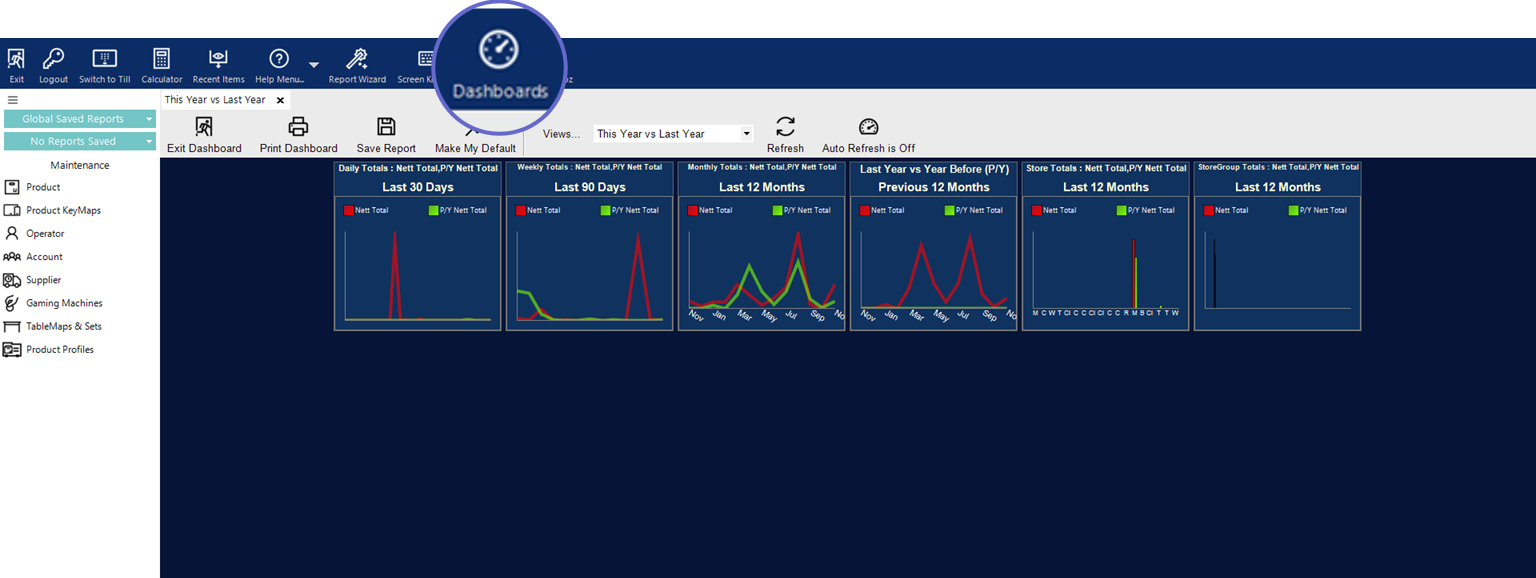
- Double-click on the Charts or Graphs to view the data in a tabular format
Additional Features
Feature |
Description |
Icon |
Make My Default |
|
|
| Views |
|
|
| Refresh |
|
|
| Auto Refresh |
|
|

