Overview
Problem / Symptoms:
There might be times where you notice that for this example Smartcontroller is using more system memory than expected.
In some cases, this is valid as Smartcontroller might be performing a task that requires high memory resources, but then smartcontroller should then settle back down to an expected memory value.
Where there is a case where Smartcontroller is not reducing the memory allocation, you might have a memory leak or a task that smartcontroller is trying to run but cannot complete.
Diagnosis:
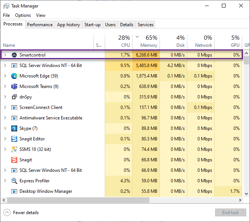
Task manager shows high memory usage for Smartcontroller and this value does not decrease over a period of time
Solution / resolution:
To try and pinpoint the affected areas where this might be happening there are 2 tools that could highlight the affected area to investigate, these tool might not highlight anything. Diagnosing memory issues can be your worse nightmare.
But I will show some steps that can be taken to potentially highlight an applications area of where the problem might be.
The First Tool in your arsenal is a Tool from Microsoft Called ‘Debug Diagnostic Tool’
Download Link: Download Debug Diagnostic Tool v2 Update 2 from Official Microsoft Download Center
This tool gives you the ability to monitor a process and create a dump file for ‘Crash’, Performance and ‘Memory and Handle Leaks’
In this example we have a Smartcontroller that is spiking memory to 6GB, resulting in taking up 80%+ of the system resources that could lead to other performance issues.
What you need to do is create a dump log using the following steps.
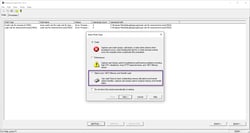
Run DebugDiag 2 Collection
This will then present with a Selection of Rule Types, in our case we are looking into a memory issue.
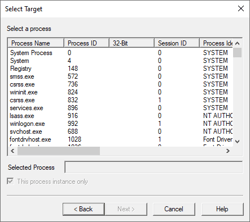
The next prompt will ask you which application you would like to monitor, in our case this will be smartcontroller.
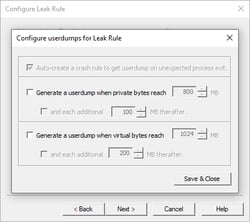
Within the next option you need to specify when the collection needs to be dumped or wait for the program to spike the memory and create a dump manually
In our example we have seen that the smartcontroller reaches over 6GB of RAM so we can specify the private bytes to be 6000 here. Save and Close
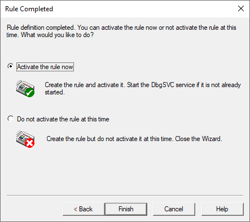
Click Next and then Activate the rule now and then Finish
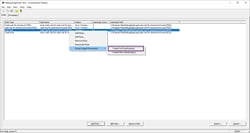
This will then monitor smartcontroller and when the memory reaches 6GB it will create a dump file. Or you can manually do it by right clicking the job and select full dump when the program has spiked to 6GB
Once the dump has been created you then need to run the dump through the Debug Analysis
Run the application DebugDiag Analysis
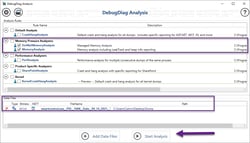
Select the memory analyser’s and add the Data files (dump) and then click start Analysis
It will now start checking the dump file and once completed generate a report that can be reviewed.
Now comes the tricky part.
The report generated and should show an Analysis Summary
On a quick glance, we can See GC Heap Usage is very High. But that still doesn’t really tell us much,
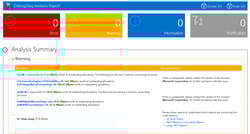
but if we keep scrolling down through the Report, what was highlight in this example was the following Xfer.dll was high memory usage in Xfer.Audit.
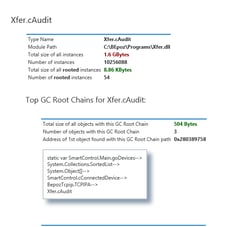
Like I have mentioned above this is not going to show you the actual problem but it could highlight that we have an issue related to Audits so this is my best course of action right now to see what is happening with audits.
Once investigated it was quite clear to see that there were 10 million audits created in 1 days causing Smartcontrollers heavy load that couldn’t complete in a timely fashion.
The Second Tool is SQL Profiler or Express Profiler
Generally speaking, in the above case scenario when we restarted Smartcontroller the memory was fine at start-up and it did not inflate to 6GB right away.
What was happening was that when a new audit was being created that was an ErrorLog Audit it was trying to process the previous 10 million records, it is when this event happened that Smartcontroller started to exploded to 6GB memory usage.
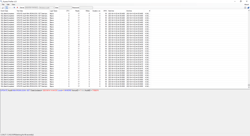
A simple tool like SQL Profiler would have highlighted the SQLBatch queries also pointing you in the right direction as you can see that Smartcontoller is trying to process thousands of records.