This article will cover an overview on Period Summaries with the the addition of relevant configurations and data features that can be made. For ease of readability, the Period Summary Report is divided into six categories: Stock Summary; Account Summary; Sales Summary; Discount Totals; Banking Summary; and Product TypeGroup Sales. This article is broken down into sections for each of the aforementioned categories and details the formulas used to obtain the data in each.
This article will cover an overview on Period Summaries with the the addition of relevant configurations and data features that can be made.
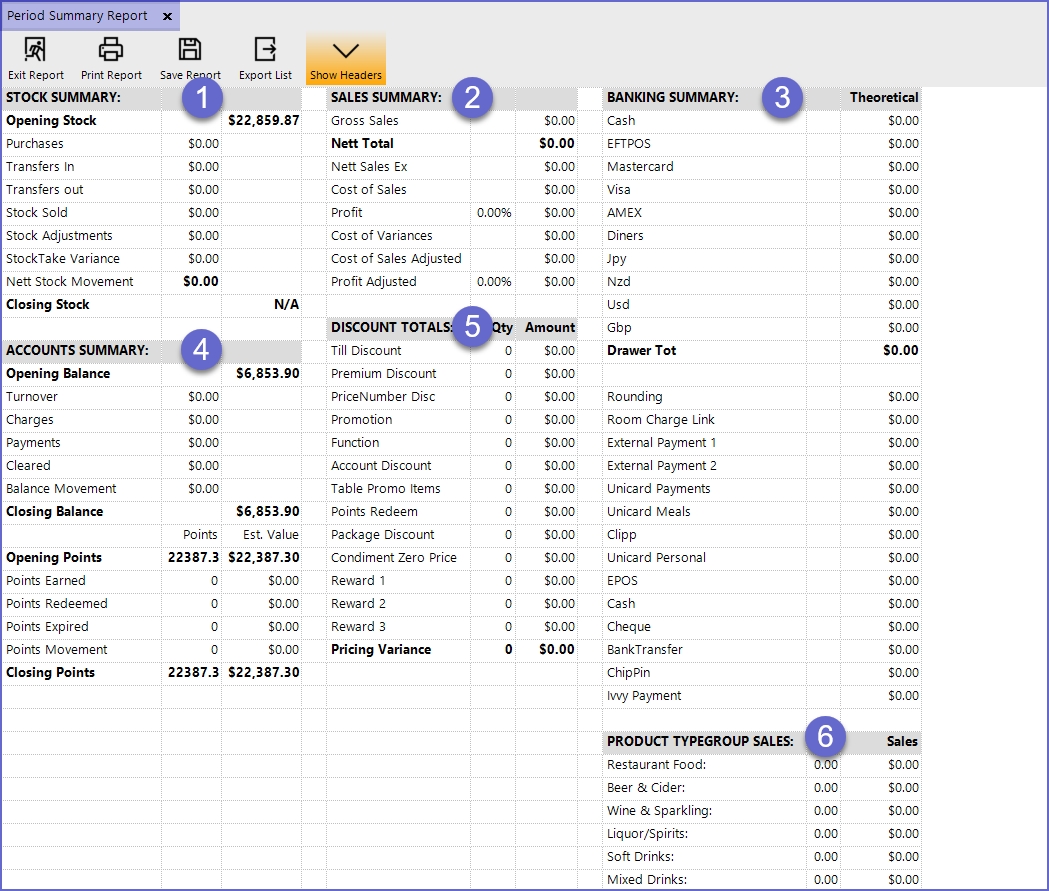
For ease of readability, the Period Summary Report is divided into six categories: Stock Summary; Account Summary; Sales Summary; Discount Totals; Banking Summary; and Product TypeGroup Sales.
This article is broken down into sections for each of the aforementioned categories and details the formulas used to obtain the data in each.
Prerequisites- To access Period Summary Settings, the applicable Operator Privileges will need to be enabled
- Operator Maintenance 'Reporting' Tab
- Sales Reports: "Allow Cash Reports" Flag
Period Summary Report Overview & Breakdown
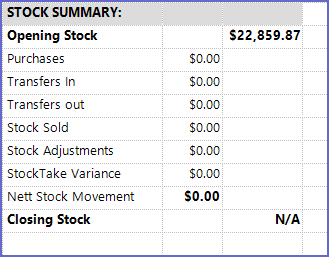
Stock Summary Section
- This section displays the Stock Movements in the given time period and the value of Stock Movements
- The Stock Summary section of the Period Summary Report consists of the following fields:
Field Name |
Data Description/Formula |
| Opening Stock |
|
| Purchases |
|
| Transfers In |
|
| Transfers Out |
|
| Stock Sold |
|
| Stock Adjustments |
|
| StockTake Variance |
|
| Nett Stock Movement |
|
| Closing Stock |
|
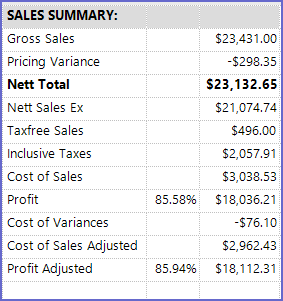
Sales Summary Section
- The Sales Summary section displays the sales history of the business including the Cost Variances and Adjusted Sales
- The Sales Summary displays the Sales information for the given period of time:
Field Name |
Data Description/Formula |
| Gross Sales |
|
| Pricing Variance |
|
| Nett Total |
|
| Nett Sales Ex |
|
| Taxfree Sales |
|
| Inclusive Taxes |
|
| Cost of Sales |
|
| Profit |
|
| Cost of Variances |
|
| Cost of Sales Adjusted |
|
| Profit Adjusted |
|
Banking Summary Section
- This section displays the different types of Payment mediums used by the business and the total value of the Transactions processed from each of the mediums
- This section includes the following options:
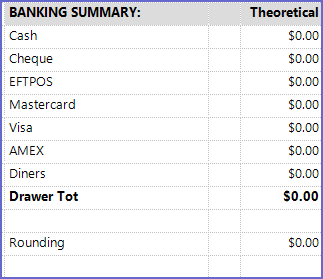
- The Payment mediums seen in this example may differ depending on System configurations
Field Name |
Data Description |
| Cash |
|
| EFTPOS |
|
| MasterCard |
|
| Visa |
|
|
AMEX |
|
| Others... |
|
| Drawer Tot |
|
| Rounding |
|
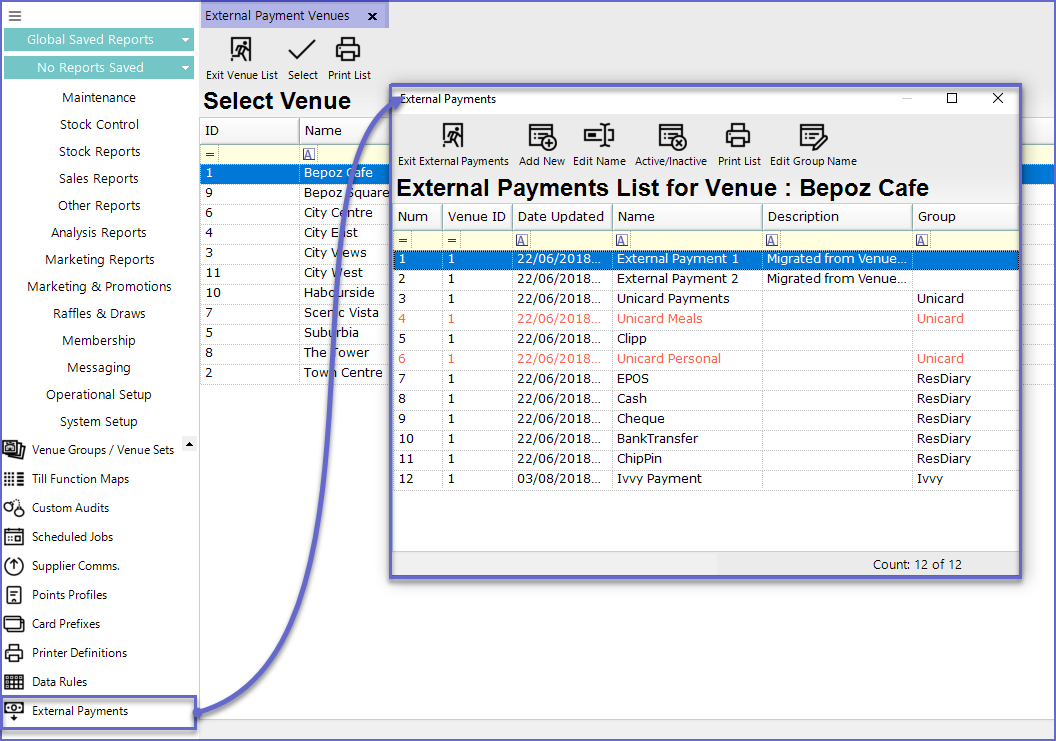
- The transaction media in the Banking Summary is not limited to the given list
- Additional external systems' payments can be added according to the Organization's business preferences
- This can be done from the Global Settings component in BackOffice
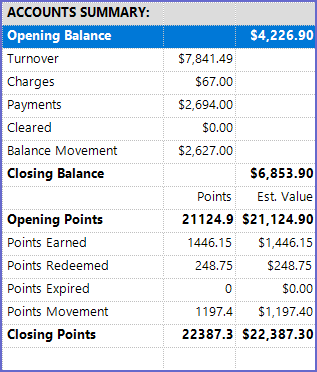
Account Summary Section
- The Account Summary section displays the total turnover and payments made from Account transactions along with the details about the Points system
- This section displays the information regarding different Account holders in the System's database:
Field Name |
Data Description |
| Turnover |
|
| Charges |
|
| Payments |
|
| Cleared |
|
| Balance Movement |
|
| Opening Points |
|
| Points Earned |
|
| Points Redeemed |
|
| POints Expired |
|
| Points Movement |
|
| Closing Points |
|
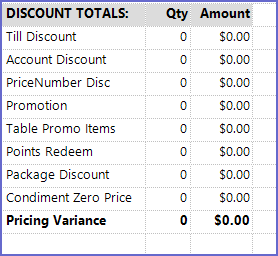
Discount Totals Section
- The Discount Totals section displays the Total Value of all the Discounts given during the reporting period along with the total value of each discount type
- This section consists of the following fields:
Field Name |
Data Description/Formula |
| Till Discount |
|
| Account Discount |
|
| Price Number Disc |
|
| Promotion |
|
| Table Promo Items |
|
| Points Redeem |
|
| Package Discount |
|
| Condiment Zero Price |
|
| Pricing Variance |
|
Product TypeGroup Sales Section
- This section displays all the Product TypesGroups and the revenue generated from each of the TypeGroups
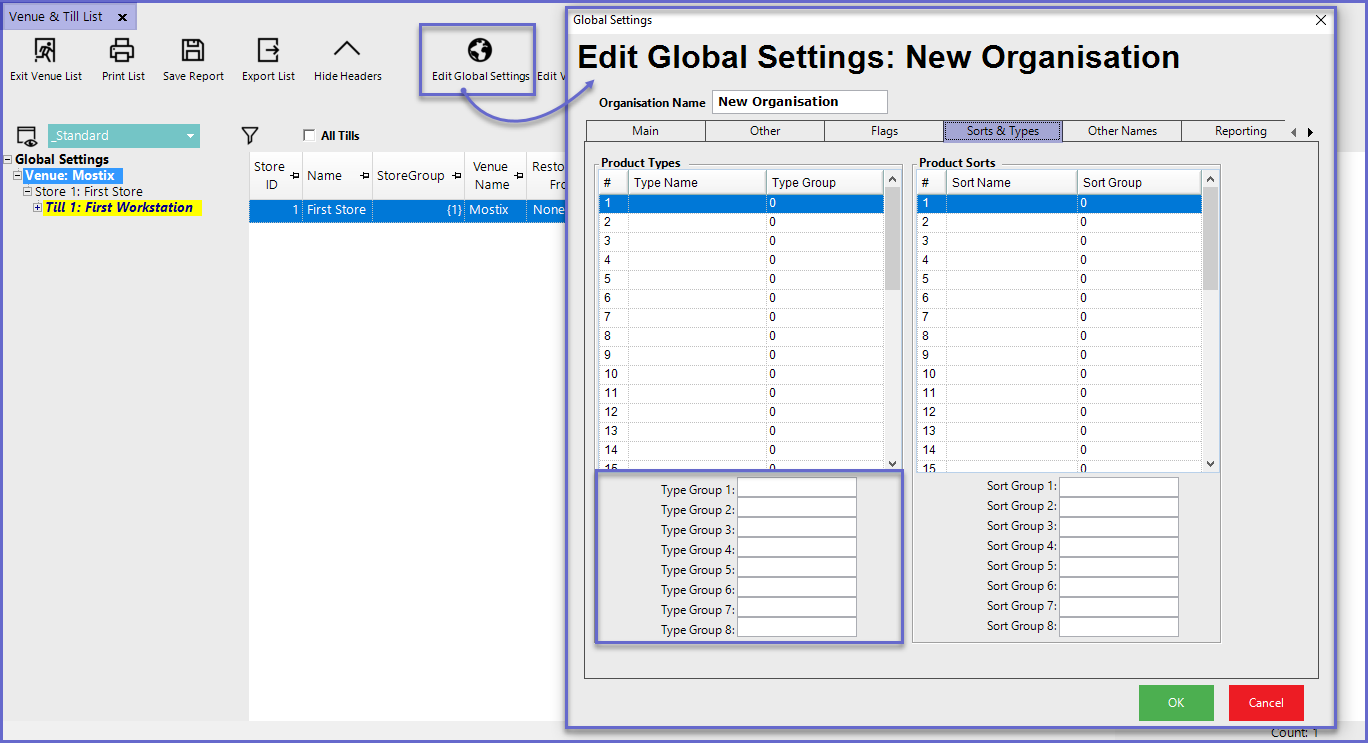
- The TypeGroups listed will differ from this example depending on the System's configured Product Type Groups which can be found in Global Settings
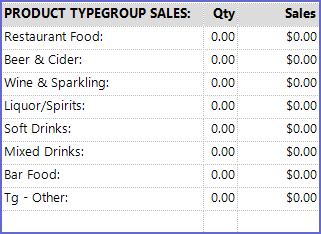
- This section displays all the Product TypeGroups that have been added to the system along with the Quantity Sold and the Value of Sales
- The Qty column displays the Total Quantity of Product Type Groups sold in the Given period
- The Sales column displays the Total Sales occurred for the product in the given period
- Organizations can create up to 8 Product Type Groups and 30 Product Types with the Bepoz system; these Type Groups and Types can be easily added and edited from Global Settings > Sorts & Types Tab