
- INTERNAL - Bepoz Help Guides
- End-User | Stock Control
- Stock & Analysis Reports
-
End-User | Products & SmartPOS
-
End-User | Stock Control
-
End-User | Table Service and Kitchen Operations
-
End-User | Pricing, Marketing, Promotions & Accounts
- Prize Promotions
- Points, Points Profiles and Loyalty
- Product Promotions
- Repricing & Discounts in SmartPOS
- Vouchers
- Account Till Functions
- Pricing, Price Numbers and Price Modes
- Raffles & Draws
- Marketing Reports
- Accounts and Account Profiles
- Rewards
- SmartPOS Account Functions
- Troubleshooting
- Product Labels
- Packing Slips
-
End-User | System Setup & Admin
-
End-User | Reporting, Data Analysis & Security
-
End-User | Membership & Scheduled Billing
-
End-User | Operators, Operator Permissions & Clocking
-
Interfaces | Data Send Interfaces
-
Interfaces | EFTPOS & Payments
- NZ EFTPOS Interfaces
- Linkly (Formerly PC-EFTPOS)
- Adyen
- Tyro
- ANZ BladePay
- Stripe
- Windcave (Formerly Payment Express)
- Albert EFTPOS
- Westpac Presto (Formerly Assembly Payments)
- Unicard
- Manager Cards External Payment
- Pocket Voucher
- OneTab
- Clipp
- eConnect-eConduit
- Verifone
- AXEPT
- DPS
- Liven
- Singapore eWallet
- Mercury Payments TRANSENTRY
- Ingenico
- Quest
- Oolio - wPay
-
Interfaces | SMS & Messaging
-
Interfaces | Product, Pricing, Marketing & Promotions
- Metcash Loyalty
- Range Servant
- ILG Pricebook & Promotions
- Oolio Order Manager Integration
- Ubiquiti
- Product Level Blocking
- BidFood Integration
- LMG
- Metcash/IBA E-Commerce Marketplace
- McWilliams
- Thirsty Camel Hump Club
- LMG Loyalty (Zen Global)
- Doshii Integration
- Impact Data
- Marsello
- IBA Data Import
- Materials Control
- Last Yard
- Bepoz Standard Transaction Import
-
Interfaces | Printing & KDS
-
Interfaces | Reservation & Bookings
-
Interfaces | Database, Reporting, ERP & BI
-
Interfaces | CALink, Accounts & Gaming
- EBET Interface
- Clubs Online Interface
- Konami Interface
- WIN Gaming Interface
- Aristocrat Interface
- Bally Interface
- WorldSmart's SmartRetail Loyalty
- Flexinet & Flexinet SP Interfaces
- Aura Interface
- MiClub Interface
- Max Gaming Interface
- Utopia Gaming Interface
- Compass Interface
- IGT & IGT Casino Interface
- MGT Gaming Interface
- System Express
- Aristocrat nConnect Interface
- GCS Interface
- Maxetag Interface
- Dacom 5000E Interface
- InnTouch Interface
- Generic & Misc. CALink
-
Interfaces | Miscellaneous Interfaces/Integrations
-
Interfaces | Property & Room Management
-
Interfaces | Online Ordering & Delivery
-
Interfaces | Purchasing, Accounting & Supplier Comms
-
SmartPOS | Mobile App
-
SmartPDE | SmartPDE 32
-
SmartPDE | Denso PDE
-
SmartPDE | SmartPDE Mobile App
-
MyPlace
-
MyPlace | myPLACE Lite
-
MyPlace | Backpanel User Guides
- Bepoz Price Promotions
- What's on, Events and tickets
- Staff
- System Settings | Operational Settings
- Vouchers & Gift Certificates
- Member Onboarding
- Members and memberships
- System Settings | System Setup
- Reports and Reporting
- Actions
- Offers | Promotions
- Messaging & Notifications
- System Settings | App Config
- Surveys
- Games
- User Feedback
- Stamp Cards
-
MyPlace | Integrations
-
MyPlace | FAQ's & How-2's
-
MyPlace | Release Notes
-
YourOrder
-
YourOrders | Backpanel User Guides
-
YourOrders | YourOrder Kiosk User Guide
-
YourOrders | Merchant App User Guide
-
WebAddons
-
Installation / System Setup Guides
- SmartPOS Mobile App | Setup
- SmartPOS Mobile App | SmartAPI Host Setup
- SmartPOS Mobile App | BackOffice Setup
- SmartPOS Mobile App | Pay@Table setup
- SmartKDS Setup 4.7.2.7 +
- SmartKDS Setup 4.6.x
- SQL Installations
- Server / BackOffice Installation
- New Database Creation
- Multivenue Setup & Config.
- SmartPOS
- SmartPDE
- Player Elite Interface | Rest API
- Interface Setups
- Import
- KDSLink
- Snapshots
- Custom Interface Setups
-
HOW-2
- Product Maintenance
- Sales and Transaction Reporting
- SmartPOS General
- Printing and Printing Profiles
- SQL
- Repricing & Discounts
- Stock Control
- Membership
- Accounts and Account Profiles
- Miscellaneous
- Scheduled Jobs Setups
- Backoffice General
- Purchasing and Receiving
- Database.exe
- EFTPOS
- System Setup
- Custom Support Tools
-
Troubleshooting
-
Hardware
11 | Stock Summaries Data Explained
This article explains the formulas that are used to generate different columns of Stock Summaries Report data. The system provides three types of View options to display the report, which are: Standard View; Transfers View; and Loss View. These View options have different data columns which can be generated by using general or customized formulas.
This article explains the formulas that are used to generate different columns of Stock Summaries Report data.
The system provides three types of View options to display the report, which are: Standard View; Transfers View; and Loss View. These View options have different data columns which can be generated by using general or customized formulas.
Prerequisites- To access Stock Summary Settings, the applicable Operator Privileges will need to be enabled
- Operator Maintenance 'Reporting' Tab
- Sales Reports: "Allow Stock Reports" Flag
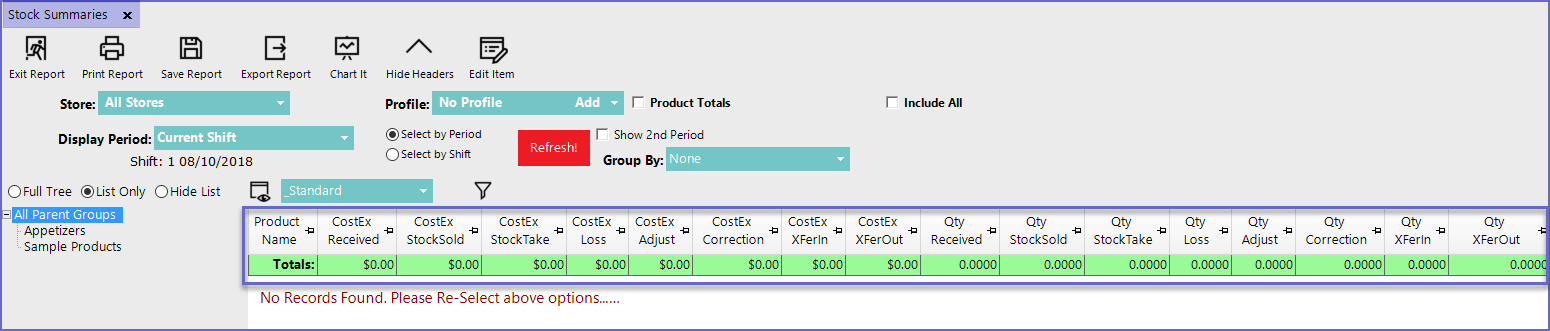
"_Standard" View Formulas
- The Standard View for the Stock Summaries Report consists of the following data columns by default:
Column Heading |
Data Description |
Formulas |
| Cost Ex Received |
|
|
| Cost Ex Stock Sold |
|
|
| Cost Ex Stock-Take |
|
|
| Cost Ex Loss |
|
|
| Cost Ex Adjust |
|
|
| Cost Ex Correction |
|
|
| Cost Ex XferIn |
|
|
| Cost Ex XferOut |
|
|
| Qty Received |
|
|
| Qty StockSold |
|
|
| Qty Stocktake |
|
|
| Qty Loss |
|
|
| Qty Adjust |
|
|
| Qty Correction |
|
|
| Qty XferIn |
|
|
| Qty XferOut |
|
|
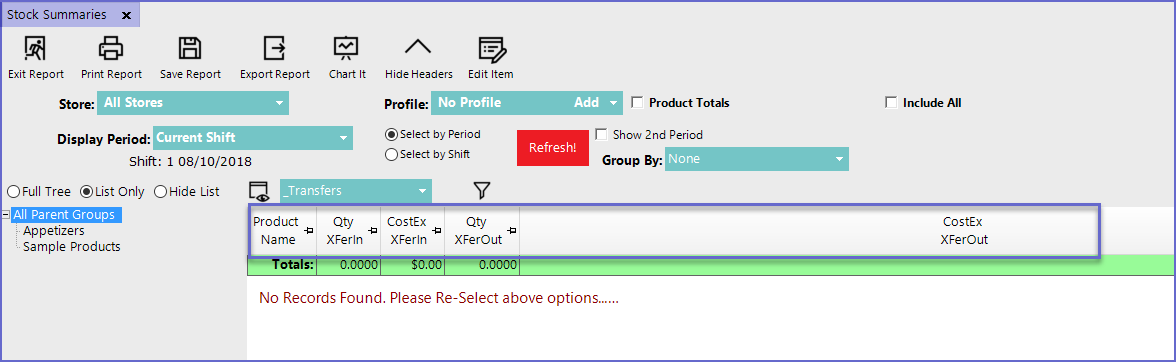
"_Transfers" View Formulas
- The Transfers View contains the following data columns by default:
Column Heading |
Data Description |
|
| Qty XferIn |
|
|
| CostEx XferIn |
|
|
| Qty XferOut |
|
|
| CostEx XferOut |
|
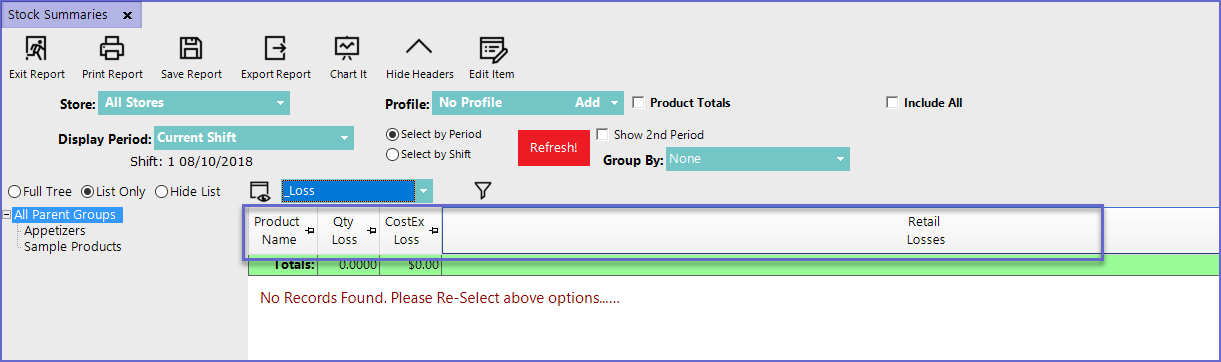
"_Loss" View Formulas
- The Loss View contains the following data columns by default:
Column Heading |
Data Description |
Formula |
| Qty Loss |
|
|
| CostEx Loss |
|
|
| Retail Losses |
|
|