-
End-User | Products & SmartPOS
-
End-User | Stock Control
-
End-User | Table Service and Kitchen Operations
-
End-User | Pricing, Marketing, Promotions & Accounts
- Prize Promotions
- Points, Points Profiles and Loyalty
- Product Promotions
- Repricing & Discounts in SmartPOS
- Vouchers
- Account Till Functions
- Pricing, Price Numbers and Price Modes
- Raffles & Draws
- Marketing Reports
- Accounts and Account Profiles
- Rewards
- SmartPOS Account Functions
- Troubleshooting
- Product Labels
- Packing Slips
-
End-User | System Setup & Admin
-
End-User | Reporting, Data Analysis & Security
-
End-User | Membership & Scheduled Billing
-
End-User | Operators, Operator Permissions & Clocking
-
Interfaces | Data Send Interfaces
-
Interfaces | EFTPOS & Payments
- NZ EFTPOS Interfaces
- Linkly (Formerly PC-EFTPOS)
- Adyen
- Tyro
- ANZ BladePay
- Stripe
- Windcave (Formerly Payment Express)
- Albert EFTPOS
- Westpac Presto (Formerly Assembly Payments)
- Unicard
- Manager Cards External Payment
- Pocket Voucher
- OneTab
- Clipp
- eConnect-eConduit
- Verifone
- AXEPT
- DPS
- Liven
- Singapore eWallet
- Mercury Payments TRANSENTRY
- Ingenico
- Quest
- Oolio - wPay
-
Interfaces | SMS & Messaging
-
Interfaces | Product, Pricing, Marketing & Promotions
- Metcash Loyalty
- Range Servant
- ILG Pricebook & Promotions
- Oolio Order Manager Integration
- Ubiquiti
- Product Level Blocking
- BidFood Integration
- LMG
- Metcash/IBA E-Commerce Marketplace
- McWilliams
- Thirsty Camel Hump Club
- LMG Loyalty (Zen Global)
- Doshii Integration
- Impact Data
- Marsello
- IBA Data Import
- Materials Control
- Last Yard
- Bepoz Standard Transaction Import
-
Interfaces | Printing & KDS
-
Interfaces | Reservation & Bookings
-
Interfaces | Database, Reporting, ERP & BI
-
Interfaces | CALink, Accounts & Gaming
- EBET Interface
- Clubs Online Interface
- Konami Interface
- WIN Gaming Interface
- Aristocrat Interface
- Bally Interface
- WorldSmart's SmartRetail Loyalty
- Flexinet & Flexinet SP Interfaces
- Aura Interface
- MiClub Interface
- Max Gaming Interface
- Utopia Gaming Interface
- Compass Interface
- IGT & IGT Casino Interface
- MGT Gaming Interface
- System Express
- Aristocrat nConnect Interface
- GCS Interface
- Maxetag Interface
- Dacom 5000E Interface
- InnTouch Interface
- Generic & Misc. CALink
-
Interfaces | Miscellaneous Interfaces/Integrations
-
Interfaces | Property & Room Management
-
Interfaces | Online Ordering & Delivery
-
Interfaces | Purchasing, Accounting & Supplier Comms
-
SmartPOS | Mobile App
-
SmartPDE | SmartPDE 32
-
SmartPDE | Denso PDE
-
SmartPDE | SmartPDE Mobile App
-
MyPlace
-
MyPlace | myPLACE Lite
-
MyPlace | Backpanel User Guides
- Bepoz Price Promotions
- What's on, Events and tickets
- Staff
- System Settings | Operational Settings
- Vouchers & Gift Certificates
- Member Onboarding
- Members and memberships
- System Settings | System Setup
- Reports and Reporting
- Actions
- Offers | Promotions
- Messaging & Notifications
- System Settings | App Config
- Surveys
- Games
- User Feedback
- Stamp Cards
-
MyPlace | Integrations
-
MyPlace | FAQ's & How-2's
-
MyPlace | Release Notes
-
YourOrder
-
YourOrders | Backpanel User Guides
-
YourOrders | YourOrder Kiosk User Guide
-
YourOrders | Merchant App User Guide
-
WebAddons
-
Installation / System Setup Guides
- SmartPOS Mobile App | Setup
- SmartPOS Mobile App | SmartAPI Host Setup
- SmartPOS Mobile App | BackOffice Setup
- SmartPOS Mobile App | Pay@Table setup
- SmartKDS Setup 4.7.2.7 +
- SmartKDS Setup 4.6.x
- SQL Installations
- Server / BackOffice Installation
- New Database Creation
- Multivenue Setup & Config.
- SmartPOS
- SmartPDE
- Player Elite Interface | Rest API
- Interface Setups
- Import
- KDSLink
- Snapshots
- Custom Interface Setups
-
HOW-2
- Product Maintenance
- Sales and Transaction Reporting
- SmartPOS General
- Printing and Printing Profiles
- SQL
- Repricing & Discounts
- Stock Control
- Membership
- Accounts and Account Profiles
- Miscellaneous
- Scheduled Jobs Setups
- Backoffice General
- Purchasing and Receiving
- Database.exe
- EFTPOS
- System Setup
- Custom Support Tools
-
Troubleshooting
-
Hardware
2 | Till Summaries Overview
This article covers the basics of Till Summaries, Toolbar Options and Creating Custom Views for the Till Summaries Report. The Till Summaries Report is used to display Cash balancing information, as well as summaries of Sales by SmartPOS Workstation, Store, Store Group, or Venue. The Report also shows a summary of Product Sales, Account Sales, and Table Sales.
This article covers the basics of Till Summaries, Toolbar Options and Creating Custom Views for the Till Summaries Report.
The Till Summaries Report is used to display Cash balancing information, as well as summaries of Sales by SmartPOS Workstation, Store, Store Group, or Venue.
The Report also shows a summary of Product Sales, Account Sales, and Table Sales.
As with other Reports, a Chart can be generated for selected columns in the report, and sales from one period can be compared to another period.
Prerequisites- To access Till Summary features, the applicable Operator Privileges will need to be enabled
- Operator Maintenance 'Reporting' Tab
- Sales Reports: "Allow Cash Reports" Flag
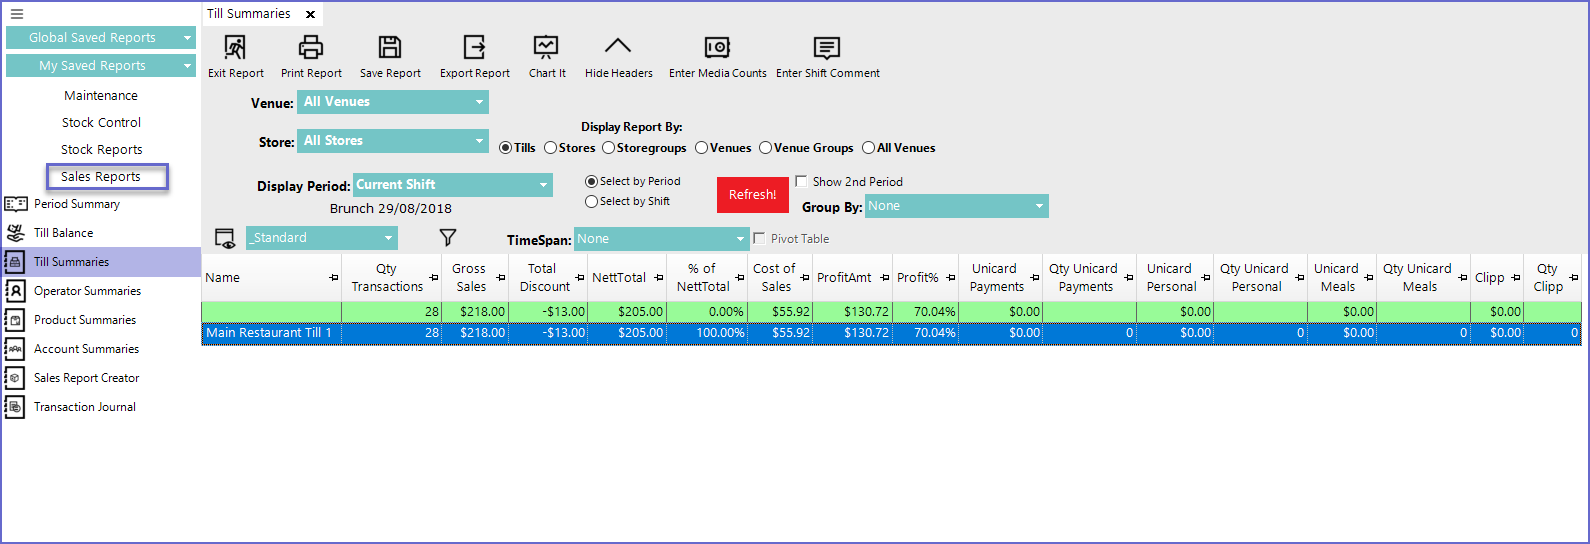
Accessing Till Summaries
- Complete the following steps to access the Till Summaries Report:
- Log in to BackOffice
- From the side menu, Select "Sales Reports" to expand the list of Available Reports
- Select Till Summaries which will open a new Till Summaries Window
Reporting Options
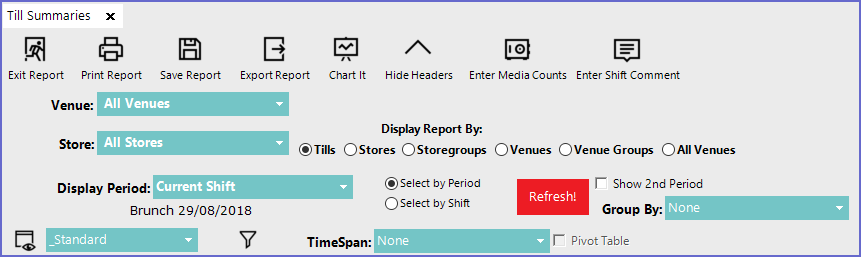
Options |
Description |
| Venue |
|
| Store |
|
| Display period |
|
| Display Report By |
|
| Show 2nd Period |
|
| Group By |
|
| View Button |
|
| Filter Button |
|
| Time Span |
|
| Pivot Table |
|


Editing Report Views Standard View
- Till Summaries Report usually displays in the Standard view unless the default view has been changed by the operator
- The standard view consists of all the data related to the Till transaction
- These data include Quantity Transaction, Gross Sales, Total Discount, Nett Total, % of NettTotal, Cost of Sales, Profit Amt, Profit %, Unicard Payments, Unicard Personal, Quantity Unicard Personal, Unicard Meals, Quantity Unicard Meals, Clipp and Quantity Clipp

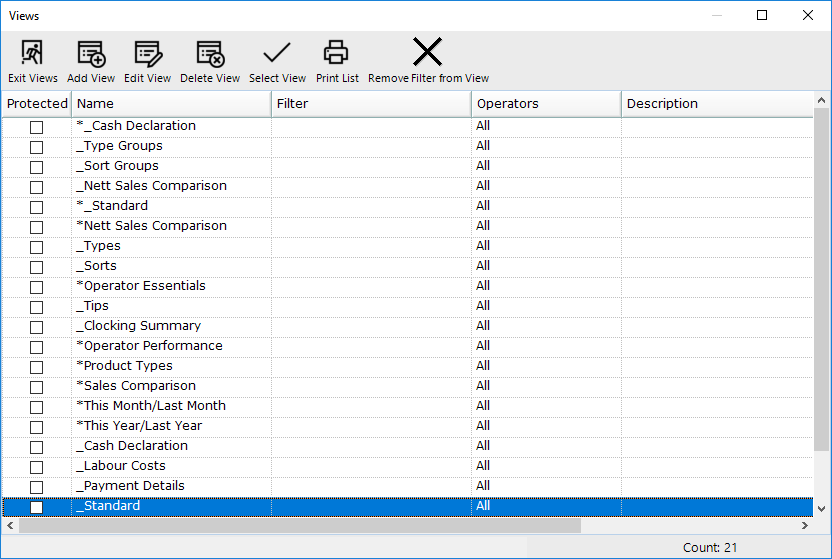
- Apart from the Standard view, there are also different custom reports available in the View Option as shown below
- Some of these can be used to view specific data such as
- _Payment Details displays the total payment via different mediums such as Cash, EFTPOS, Mastercard, Visa, AMEX etc.
- _Cash Declaration shows the Difference between Payment Total and Counted Total
- _Types displays the amount generated from different types of food
- Operators can either choose from the given custom views or, create a new view type using the Add or Edit view button to suit their preference