
- INTERNAL - Bepoz Help Guides
- End-User | Stock Control
- Stock & Analysis Reports
-
End-User | Products & SmartPOS
-
End-User | Stock Control
-
End-User | Table Service and Kitchen Operations
-
End-User | Pricing, Marketing, Promotions & Accounts
- Prize Promotions
- Points, Points Profiles and Loyalty
- Product Promotions
- Repricing & Discounts in SmartPOS
- Vouchers
- Account Till Functions
- Pricing, Price Numbers and Price Modes
- Raffles & Draws
- Marketing Reports
- Accounts and Account Profiles
- Rewards
- SmartPOS Account Functions
- Troubleshooting
- Product Labels
- Packing Slips
-
End-User | System Setup & Admin
-
End-User | Reporting, Data Analysis & Security
-
End-User | Membership & Scheduled Billing
-
End-User | Operators, Operator Permissions & Clocking
-
Interfaces | Data Send Interfaces
-
Interfaces | EFTPOS & Payments
- NZ EFTPOS Interfaces
- Linkly (Formerly PC-EFTPOS)
- Adyen
- Tyro
- ANZ BladePay
- Stripe
- Windcave (Formerly Payment Express)
- Albert EFTPOS
- Westpac Presto (Formerly Assembly Payments)
- Unicard
- Manager Cards External Payment
- Pocket Voucher
- OneTab
- Clipp
- eConnect-eConduit
- Verifone
- AXEPT
- DPS
- Liven
- Singapore eWallet
- Mercury Payments TRANSENTRY
- Ingenico
- Quest
- Oolio - wPay
-
Interfaces | SMS & Messaging
-
Interfaces | Product, Pricing, Marketing & Promotions
- Metcash Loyalty
- Range Servant
- ILG Pricebook & Promotions
- Oolio Order Manager Integration
- Ubiquiti
- Product Level Blocking
- BidFood Integration
- LMG
- Metcash/IBA E-Commerce Marketplace
- McWilliams
- Thirsty Camel Hump Club
- LMG Loyalty (Zen Global)
- Doshii Integration
- Impact Data
- Marsello
- IBA Data Import
- Materials Control
- Last Yard
- Bepoz Standard Transaction Import
-
Interfaces | Printing & KDS
-
Interfaces | Reservation & Bookings
-
Interfaces | Database, Reporting, ERP & BI
-
Interfaces | CALink, Accounts & Gaming
- EBET Interface
- Clubs Online Interface
- Konami Interface
- WIN Gaming Interface
- Aristocrat Interface
- Bally Interface
- WorldSmart's SmartRetail Loyalty
- Flexinet & Flexinet SP Interfaces
- Aura Interface
- MiClub Interface
- Max Gaming Interface
- Utopia Gaming Interface
- Compass Interface
- IGT & IGT Casino Interface
- MGT Gaming Interface
- System Express
- Aristocrat nConnect Interface
- GCS Interface
- Maxetag Interface
- Dacom 5000E Interface
- InnTouch Interface
- Generic & Misc. CALink
-
Interfaces | Miscellaneous Interfaces/Integrations
-
Interfaces | Property & Room Management
-
Interfaces | Online Ordering & Delivery
-
Interfaces | Purchasing, Accounting & Supplier Comms
-
SmartPOS | Mobile App
-
SmartPDE | SmartPDE 32
-
SmartPDE | Denso PDE
-
SmartPDE | SmartPDE Mobile App
-
MyPlace
-
MyPlace | myPLACE Lite
-
MyPlace | Backpanel User Guides
- Bepoz Price Promotions
- What's on, Events and tickets
- Staff
- System Settings | Operational Settings
- Vouchers & Gift Certificates
- Member Onboarding
- Members and memberships
- System Settings | System Setup
- Reports and Reporting
- Actions
- Offers | Promotions
- Messaging & Notifications
- System Settings | App Config
- Surveys
- Games
- User Feedback
- Stamp Cards
-
MyPlace | Integrations
-
MyPlace | FAQ's & How-2's
-
MyPlace | Release Notes
-
YourOrder
-
YourOrders | Backpanel User Guides
-
YourOrders | YourOrder Kiosk User Guide
-
YourOrders | Merchant App User Guide
-
WebAddons
-
Installation / System Setup Guides
- SmartPOS Mobile App | Setup
- SmartPOS Mobile App | SmartAPI Host Setup
- SmartPOS Mobile App | BackOffice Setup
- SmartPOS Mobile App | Pay@Table setup
- SmartKDS Setup 4.7.2.7 +
- SmartKDS Setup 4.6.x
- SQL Installations
- Server / BackOffice Installation
- New Database Creation
- Multivenue Setup & Config.
- SmartPOS
- SmartPDE
- Player Elite Interface | Rest API
- Interface Setups
- Import
- KDSLink
- Snapshots
- Custom Interface Setups
-
HOW-2
- Product Maintenance
- Sales and Transaction Reporting
- SmartPOS General
- Printing and Printing Profiles
- SQL
- Repricing & Discounts
- Stock Control
- Membership
- Accounts and Account Profiles
- Miscellaneous
- Scheduled Jobs Setups
- Backoffice General
- Purchasing and Receiving
- Database.exe
- EFTPOS
- System Setup
- Custom Support Tools
-
Troubleshooting
-
Hardware
24 | Understock/Overstock Data Explained
This article covers the standard Views of the Understock/Overstock Report.
This article covers the standard Views of the Understock/Overstock Report.
Prerequisites- To access Understock/Overstock Settings, the applicable Operator Privileges will need to be enabled
- Operator Maintenance 'Reporting' Tab
- Other Reports: "Allow Analysis Reports" Flag
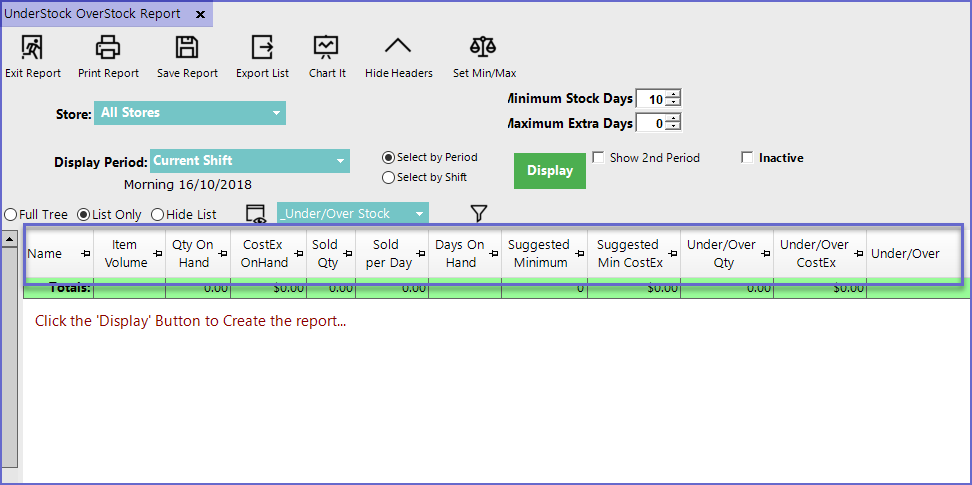
_Under/Over Stock View
- The Under/Over Stock View is one of the default views for the Understock/Overstock Report
- This report displays all the Products sold by the business and the Products' Stock status
- This report also contains columns such as Sold Quantity of Product, suggested Minimum and Maximum Stock for Product Lines and their associated Cost excluding Tax
Column Heading |
Data Description/Formula |
| Name |
|
| Item Volume |
|
| Qty On Hand |
|
| CostEx On Hand |
|
| Sold Qty |
|
| Sold Per Day |
|
| Days on Hand |
|
| Suggested Minimum |
|
| Suggested Min CostEx |
|
| Under/Over Qty |
|
| Under/Over CostEx |
|
| Under/Over |
|
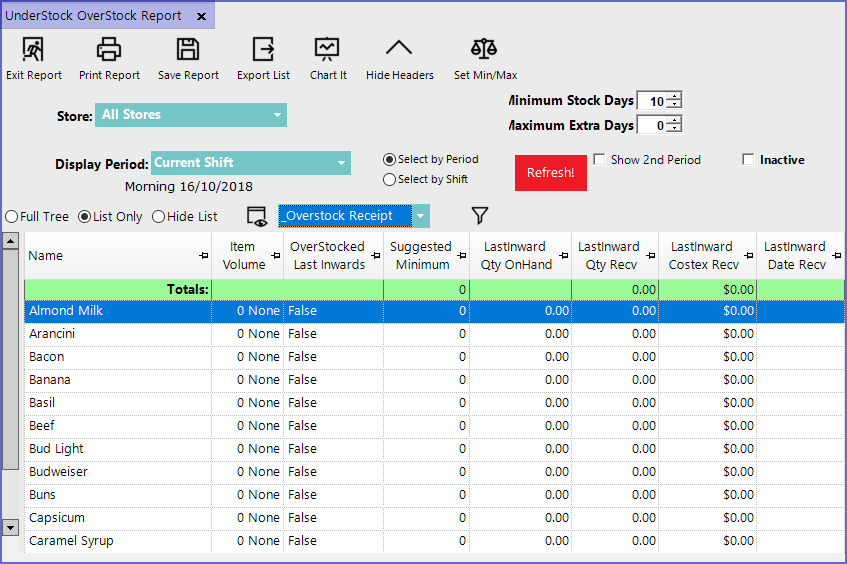
"_Overstock Receipt" View
- The Overstock Receipt View focuses on the Overstocked Items that needn't be reordered
- This View also provides information about the last delivery of the Product and the Product Stock Status before last delivery as shown below:
Column Heading |
Data Description |
| Item Volume |
|
| Overstocked Last Inwards |
|
| Suggested Minimum |
|
| LastInward Qty on Hand |
|
| Last Inward Qty Received |
|
| LastInward CostEx Received |
|
| LastInward Date Recv |
|
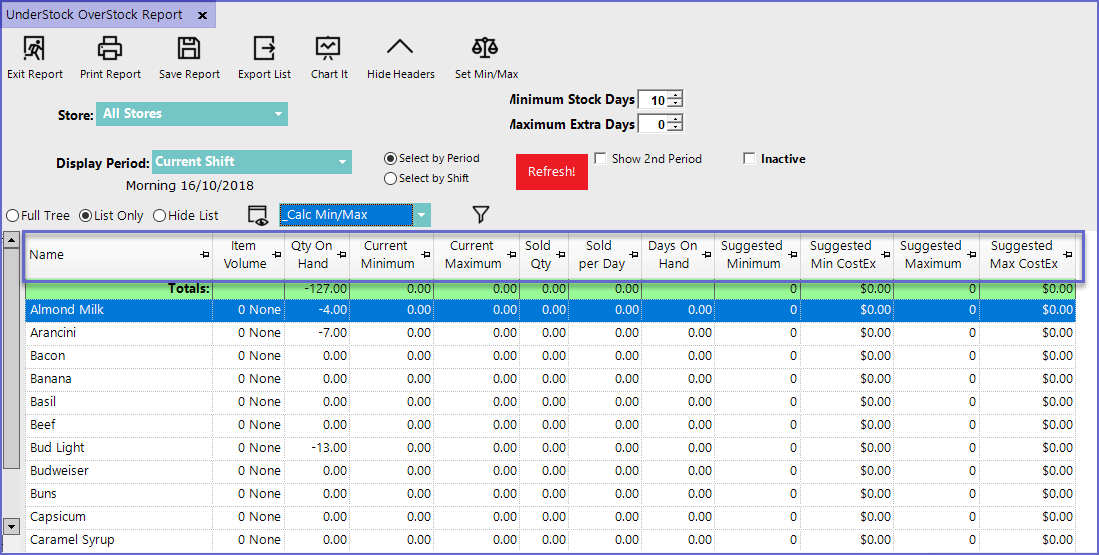
"_Calc Min/Max" View
- The Calc Min/Max View focuses on the Minimum and Maximum Number of Products that should be Stocked
- This allows business to avoid any last minute "86'ed" Product issues but can also help to be safe from Product Loss due to Expiry
Column Heading |
Data Description/Formula |
| Item Volume |
|
| Qty on Hand |
|
| Current Minimum |
|
| Current Maximum |
|
| Sold Qty |
|
| Sold Per Day |
|
| Days on Hand |
|
| Suggested Minimum |
|
| Suggested Min CostEx |
|
| Suggested Maximum |
|
| Suggested Max CostEx |
|